Research archive
AWC packed-8 20M tuning at 128K tokens per batch
Archived reference. Read the current results →
Historical report; retained as an experimental record.
Historical report. Settings and conclusions describe the recorded experiment. See the current documentation for maintained guidance.
Measured on 2026-09-12: 240 successful runs covering the complete 80-configuration LR/beta1/beta2 grid, with runtime seeds 42, 43, and 44 for every configuration. Each run trains eight local 20M models using AWC.
The best tested recipe is LR 0.0056, beta1 0.95, beta2 0.999, with mean final full-validation cross-entropy 3.609816 ± 0.005523 nats. All ± values and error bars are sample standard deviations across the three seeds, not confidence intervals. Lower loss is better.
LR 0.008 with the same betas measures 3.610121 ± 0.003780, only 0.000305 nats higher. This gap is small relative to seed variation. The winner is at the lowest tested LR and highest tested beta2; the search does not locate an interior optimum in those dimensions. Selection uses validation data, with no independent test estimate. These results do not establish statistical significance, equivalence, or global optimality.
Search space
| Parameter | Values |
|---|---|
| Learning rate | 0.0056, 0.008, 0.010, 0.0112, 0.016 |
| AdamW beta1 | 0.9, 0.925, 0.95, 0.975 |
| AdamW beta2 | 0.95, 0.98, 0.99, 0.999 |
| Runtime seeds | 42, 43, 44 |
The repeated 0.010 in the requested LR list is represented once. Every unique combination has three runs: 5 × 4 × 4 × 3 = 240. All finite outcomes are included. Ranking minimizes mean final full-validation loss, breaking exact ties by lower LR, then beta1, then beta2. There are no missing or failed configurations.
Beta1/beta2 heatmaps
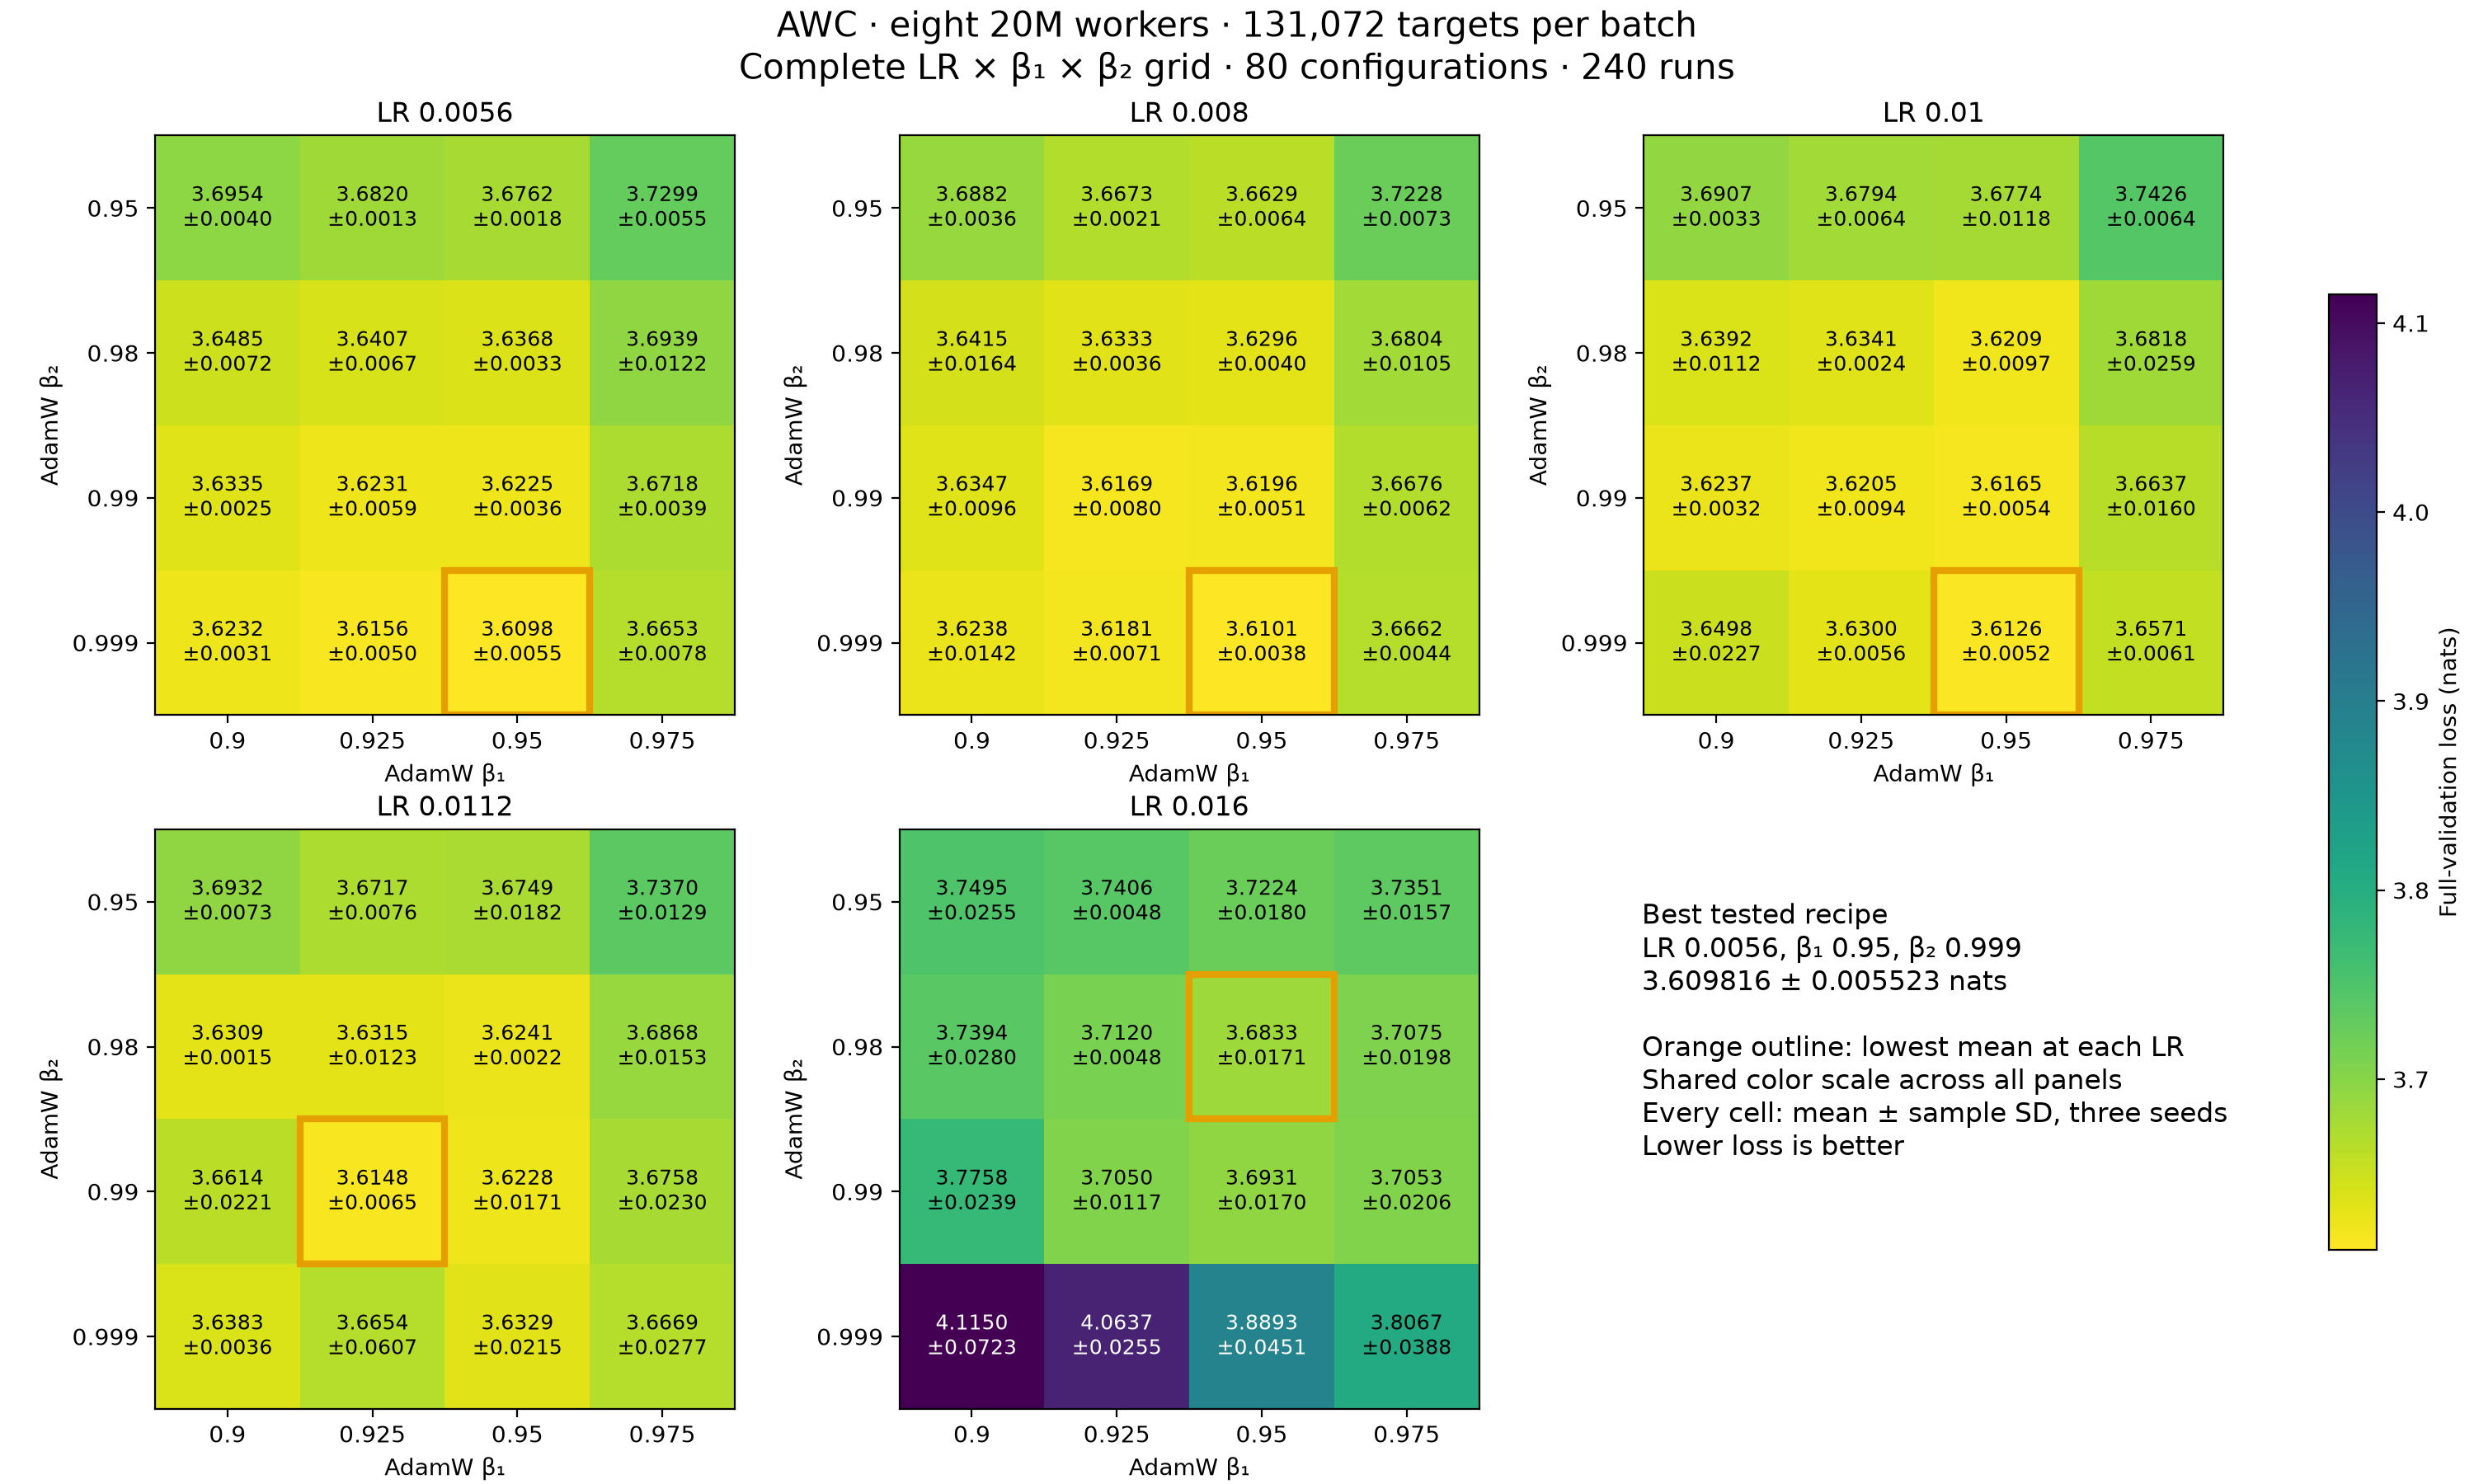
PDF · PNG. Each panel contains 16 configurations and 48 seeded runs. All five panels share a color scale; cells show mean ± sample SD. Orange outlines mark the lowest mean within each LR, so the outlines are conditional selections.
The best configurations at each learning rate are:
| LR | Beta1 | Beta2 | Mean loss ± sample SD |
|---|---|---|---|
| 0.0056 | 0.95 | 0.999 | 3.609816 ± 0.005523 |
| 0.008 | 0.95 | 0.999 | 3.610121 ± 0.003780 |
| 0.01 | 0.95 | 0.999 | 3.612587 ± 0.005239 |
| 0.0112 | 0.925 | 0.99 | 3.614815 ± 0.006469 |
| 0.016 | 0.95 | 0.98 | 3.683340 ± 0.017137 |
Beta1 0.95 and beta2 0.999 lead at LR 0.0056, 0.008, and 0.010. At LR 0.0112, the lowest mean uses beta1 0.925 and beta2 0.99. At LR 0.016, beta1 0.95 and beta2 0.98 perform best, but even that selected mean is 0.073524 nats above the overall minimum. The preferred beta2 depends on LR; a single marginal average would obscure that relationship.
Learning-rate response
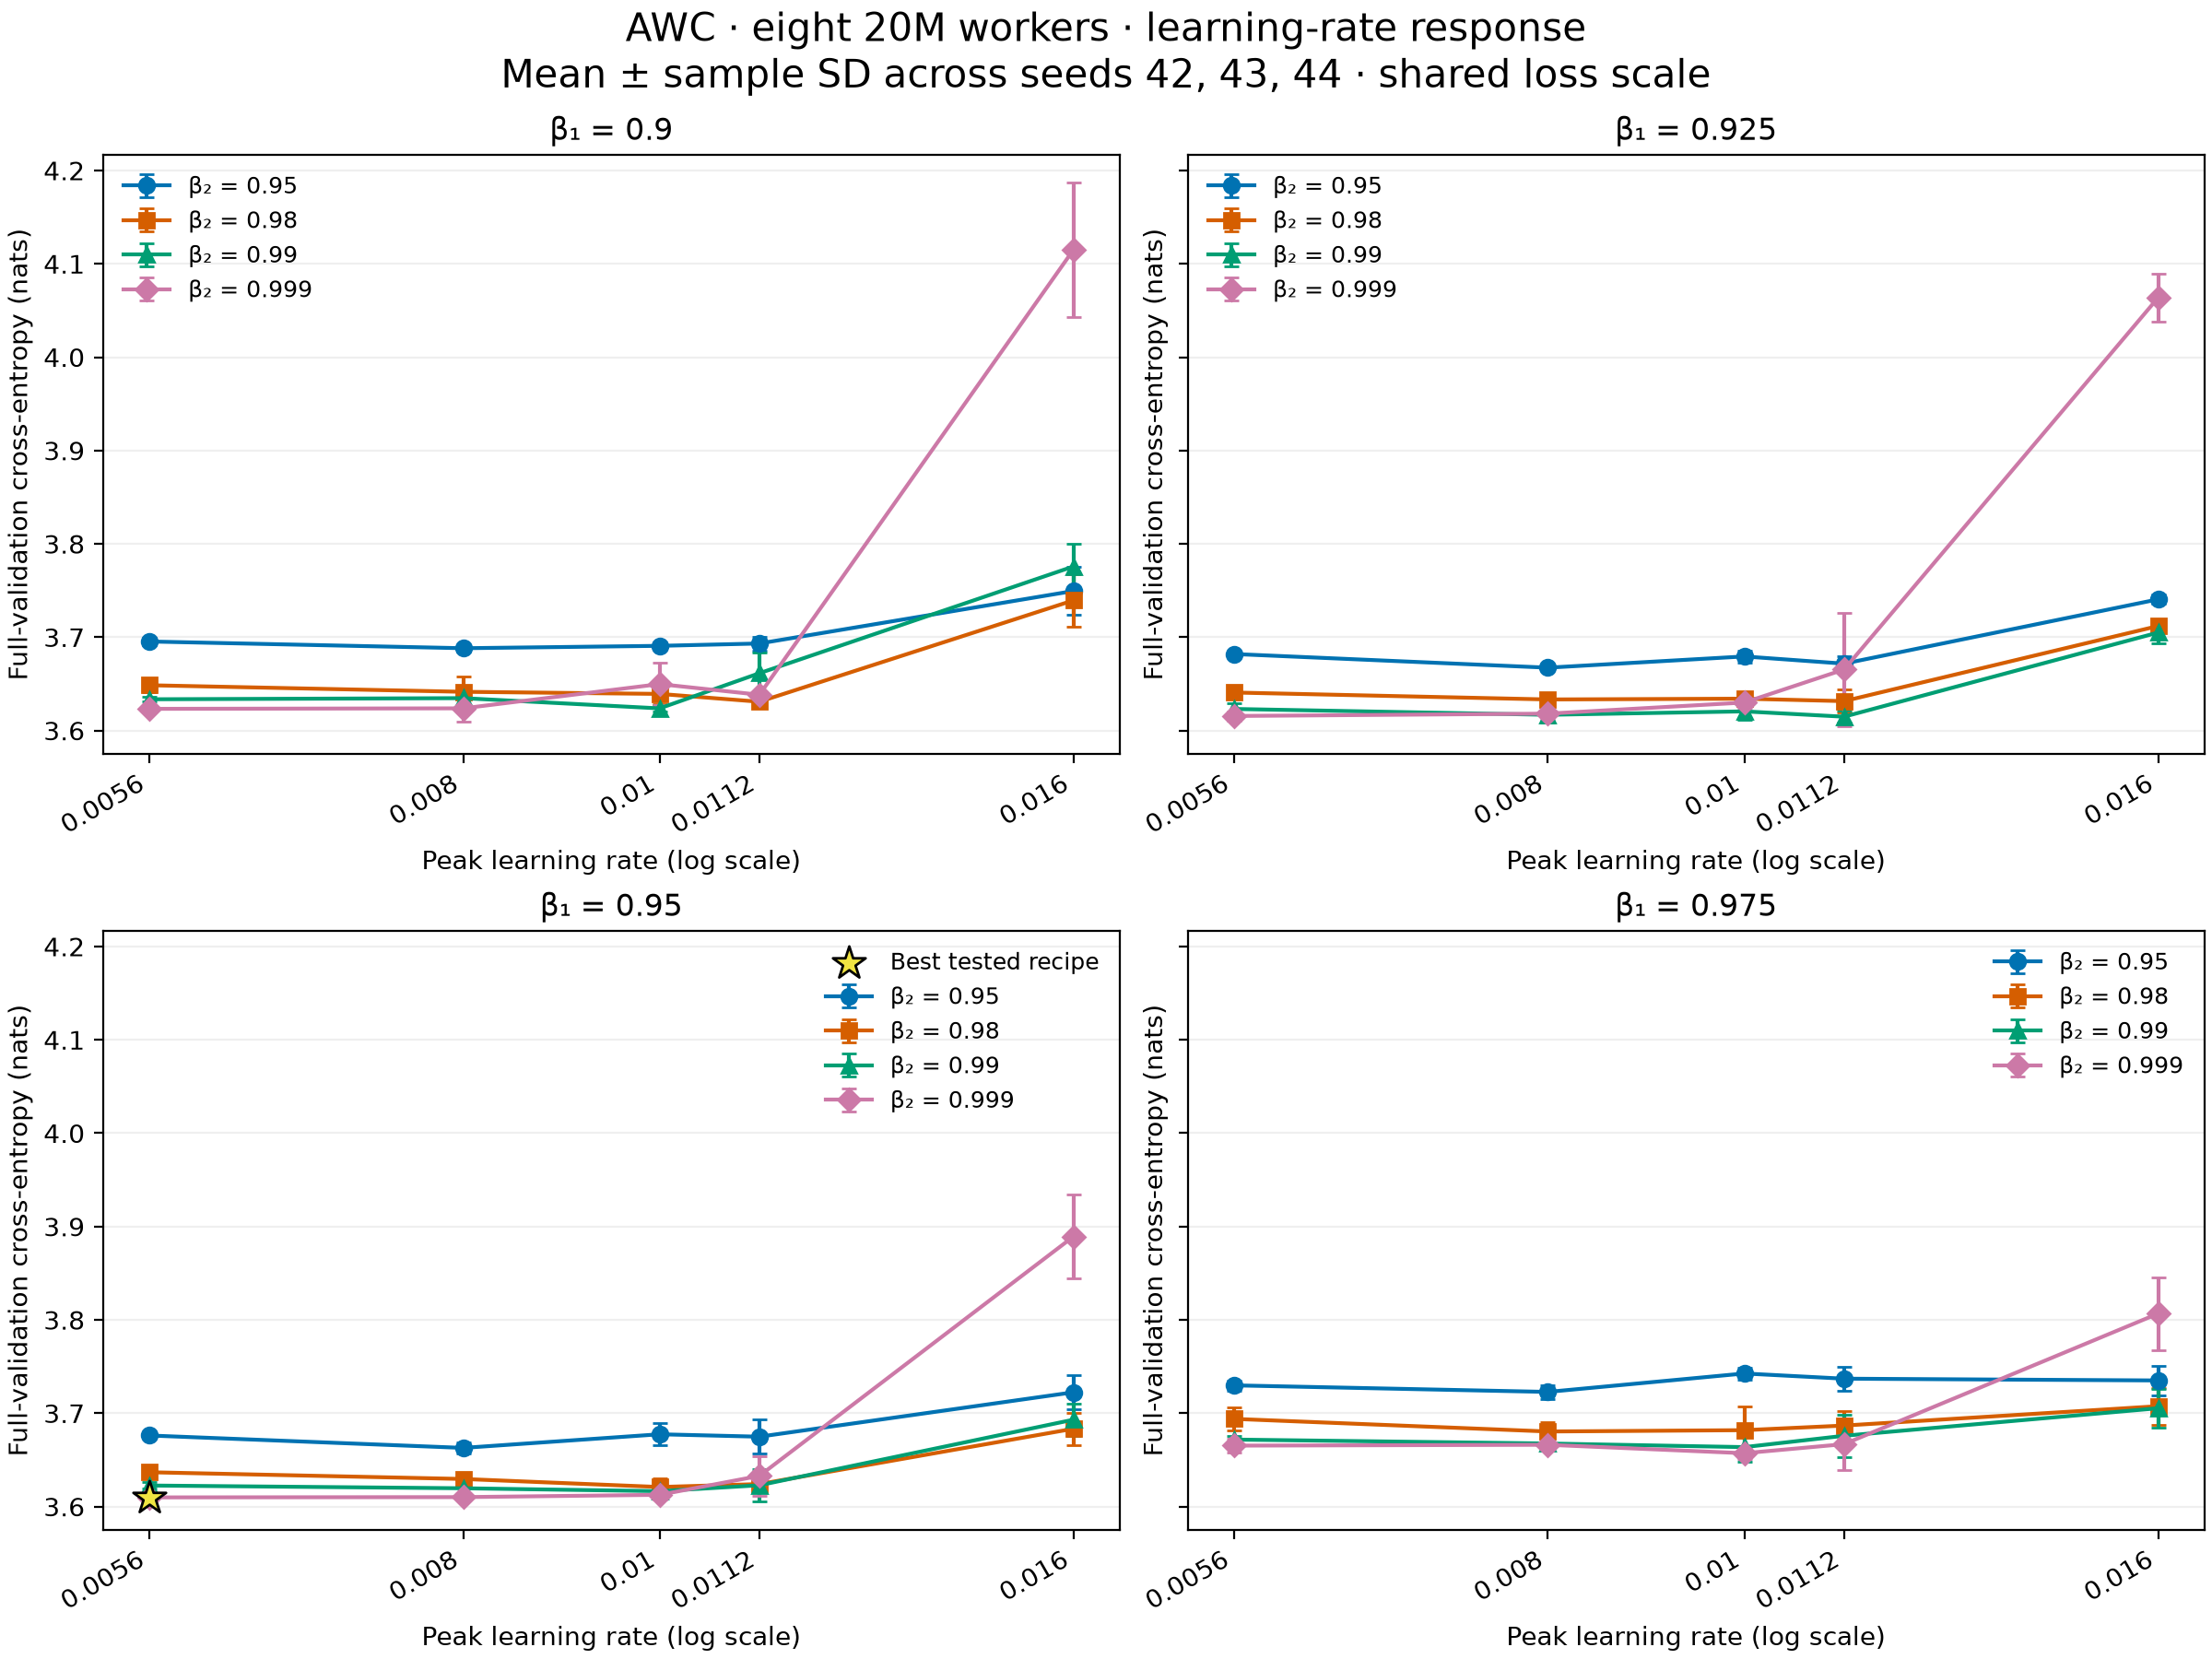
PDF · PNG. Each panel fixes beta1 and shows all four beta2 curves across the five LRs. Error bars show sample SD; all panels share the same loss scale. Lines connect measured points. The star identifies the best tested configuration.
The three leading configurations use beta1 0.95 and beta2 0.999 across LRs 0.0056–0.010. Their closely spaced means support considering this region together when interpreting the sweep. Higher LR does not improve the best achievable mean within the measured beta grid; the selected minimum at LR 0.016 is clearly higher in these measurements.
Complete ranking
All 80 configurations are included below and in the summary CSV.
| Rank | LR | Beta1 | Beta2 | Mean loss (nats) | Sample SD |
|---|---|---|---|---|---|
| 1 | 0.0056 | 0.95 | 0.999 | 3.609816 | 0.005523 |
| 2 | 0.008 | 0.95 | 0.999 | 3.610121 | 0.003780 |
| 3 | 0.01 | 0.95 | 0.999 | 3.612587 | 0.005239 |
| 4 | 0.0112 | 0.925 | 0.99 | 3.614815 | 0.006469 |
| 5 | 0.0056 | 0.925 | 0.999 | 3.615585 | 0.004953 |
| 6 | 0.01 | 0.95 | 0.99 | 3.616493 | 0.005410 |
| 7 | 0.008 | 0.925 | 0.99 | 3.616854 | 0.008050 |
| 8 | 0.008 | 0.925 | 0.999 | 3.618110 | 0.007121 |
| 9 | 0.008 | 0.95 | 0.99 | 3.619603 | 0.005069 |
| 10 | 0.01 | 0.925 | 0.99 | 3.620530 | 0.009368 |
| 11 | 0.01 | 0.95 | 0.98 | 3.620946 | 0.009662 |
| 12 | 0.0056 | 0.95 | 0.99 | 3.622543 | 0.003616 |
| 13 | 0.0112 | 0.95 | 0.99 | 3.622809 | 0.017091 |
| 14 | 0.0056 | 0.925 | 0.99 | 3.623126 | 0.005860 |
| 15 | 0.0056 | 0.9 | 0.999 | 3.623235 | 0.003125 |
| 16 | 0.01 | 0.9 | 0.99 | 3.623731 | 0.003187 |
| 17 | 0.008 | 0.9 | 0.999 | 3.623785 | 0.014239 |
| 18 | 0.0112 | 0.95 | 0.98 | 3.624088 | 0.002247 |
| 19 | 0.008 | 0.95 | 0.98 | 3.629551 | 0.003996 |
| 20 | 0.01 | 0.925 | 0.999 | 3.630001 | 0.005558 |
| 21 | 0.0112 | 0.9 | 0.98 | 3.630861 | 0.001472 |
| 22 | 0.0112 | 0.925 | 0.98 | 3.631495 | 0.012256 |
| 23 | 0.0112 | 0.95 | 0.999 | 3.632872 | 0.021452 |
| 24 | 0.008 | 0.925 | 0.98 | 3.633303 | 0.003561 |
| 25 | 0.0056 | 0.9 | 0.99 | 3.633499 | 0.002481 |
| 26 | 0.01 | 0.925 | 0.98 | 3.634125 | 0.002443 |
| 27 | 0.008 | 0.9 | 0.99 | 3.634699 | 0.009648 |
| 28 | 0.0056 | 0.95 | 0.98 | 3.636775 | 0.003345 |
| 29 | 0.0112 | 0.9 | 0.999 | 3.638334 | 0.003647 |
| 30 | 0.01 | 0.9 | 0.98 | 3.639249 | 0.011188 |
| 31 | 0.0056 | 0.925 | 0.98 | 3.640731 | 0.006696 |
| 32 | 0.008 | 0.9 | 0.98 | 3.641497 | 0.016445 |
| 33 | 0.0056 | 0.9 | 0.98 | 3.648533 | 0.007157 |
| 34 | 0.01 | 0.9 | 0.999 | 3.649752 | 0.022700 |
| 35 | 0.01 | 0.975 | 0.999 | 3.657142 | 0.006067 |
| 36 | 0.0112 | 0.9 | 0.99 | 3.661406 | 0.022119 |
| 37 | 0.008 | 0.95 | 0.95 | 3.662851 | 0.006363 |
| 38 | 0.01 | 0.975 | 0.99 | 3.663685 | 0.015993 |
| 39 | 0.0056 | 0.975 | 0.999 | 3.665291 | 0.007835 |
| 40 | 0.0112 | 0.925 | 0.999 | 3.665368 | 0.060654 |
| 41 | 0.008 | 0.975 | 0.999 | 3.666175 | 0.004378 |
| 42 | 0.0112 | 0.975 | 0.999 | 3.666870 | 0.027670 |
| 43 | 0.008 | 0.925 | 0.95 | 3.667350 | 0.002067 |
| 44 | 0.008 | 0.975 | 0.99 | 3.667554 | 0.006194 |
| 45 | 0.0112 | 0.925 | 0.95 | 3.671670 | 0.007558 |
| 46 | 0.0056 | 0.975 | 0.99 | 3.671773 | 0.003918 |
| 47 | 0.0112 | 0.95 | 0.95 | 3.674855 | 0.018216 |
| 48 | 0.0112 | 0.975 | 0.99 | 3.675832 | 0.023010 |
| 49 | 0.0056 | 0.95 | 0.95 | 3.676150 | 0.001768 |
| 50 | 0.01 | 0.95 | 0.95 | 3.677439 | 0.011847 |
| 51 | 0.01 | 0.925 | 0.95 | 3.679369 | 0.006412 |
| 52 | 0.008 | 0.975 | 0.98 | 3.680423 | 0.010460 |
| 53 | 0.01 | 0.975 | 0.98 | 3.681835 | 0.025892 |
| 54 | 0.0056 | 0.925 | 0.95 | 3.681981 | 0.001346 |
| 55 | 0.016 | 0.95 | 0.98 | 3.683340 | 0.017137 |
| 56 | 0.0112 | 0.975 | 0.98 | 3.686784 | 0.015275 |
| 57 | 0.008 | 0.9 | 0.95 | 3.688187 | 0.003637 |
| 58 | 0.01 | 0.9 | 0.95 | 3.690736 | 0.003331 |
| 59 | 0.016 | 0.95 | 0.99 | 3.693078 | 0.017020 |
| 60 | 0.0112 | 0.9 | 0.95 | 3.693248 | 0.007327 |
| 61 | 0.0056 | 0.975 | 0.98 | 3.693942 | 0.012194 |
| 62 | 0.0056 | 0.9 | 0.95 | 3.695394 | 0.004024 |
| 63 | 0.016 | 0.925 | 0.99 | 3.704963 | 0.011708 |
| 64 | 0.016 | 0.975 | 0.99 | 3.705337 | 0.020623 |
| 65 | 0.016 | 0.975 | 0.98 | 3.707514 | 0.019757 |
| 66 | 0.016 | 0.925 | 0.98 | 3.711979 | 0.004783 |
| 67 | 0.016 | 0.95 | 0.95 | 3.722426 | 0.017962 |
| 68 | 0.008 | 0.975 | 0.95 | 3.722834 | 0.007294 |
| 69 | 0.0056 | 0.975 | 0.95 | 3.729851 | 0.005455 |
| 70 | 0.016 | 0.975 | 0.95 | 3.735107 | 0.015670 |
| 71 | 0.0112 | 0.975 | 0.95 | 3.736999 | 0.012860 |
| 72 | 0.016 | 0.9 | 0.98 | 3.739440 | 0.027980 |
| 73 | 0.016 | 0.925 | 0.95 | 3.740562 | 0.004757 |
| 74 | 0.01 | 0.975 | 0.95 | 3.742566 | 0.006432 |
| 75 | 0.016 | 0.9 | 0.95 | 3.749491 | 0.025530 |
| 76 | 0.016 | 0.9 | 0.99 | 3.775755 | 0.023854 |
| 77 | 0.016 | 0.975 | 0.999 | 3.806713 | 0.038797 |
| 78 | 0.016 | 0.95 | 0.999 | 3.889272 | 0.045119 |
| 79 | 0.016 | 0.925 | 0.999 | 4.063724 | 0.025521 |
| 80 | 0.016 | 0.9 | 0.999 | 4.114962 | 0.072276 |
The selected recipe’s individual final full-validation losses are:
| Runtime seed | Loss (nats) |
|---|---|
| 42 | 3.603487168 |
| 43 | 3.612296254 |
| 44 | 3.613663870 |
Comparison with four-worker AWC
The four-worker AWC study selects LR 0.008, beta1 0.95, beta2 0.99, with 3.595559 ± 0.005025. The best eight-worker mean is 0.014257 nats higher. At that same four-worker recipe, eight workers measure 3.619603 ± 0.005069, a difference of 0.024045 nats.
There are 28 shared LR/beta1/beta2 configurations, with the same runtime seeds. Eight workers have lower means in 13 and higher means in 15. The complete matched comparison CSV contains means, sample SDs, and signed differences (eight minus four). The eight-worker winner has no exact four-worker counterpart in the measured grid.
Both studies use the same model architecture, global batch and training-token budget, cache identity, topology family, and averaged-model validation. Eight workers use microbatch 16 and 51,008,512 targets per local model; four workers use microbatch 32 and 102,017,024 targets per local model. Changing worker count also changes the mixing schedule and number of local optimizer states. The separately selected best recipes differ in LR and beta2, and the search spaces are unequal. This comparison is descriptive, not a controlled estimate of a single mechanism or a distributed scaling benchmark.
Shared training protocol
AWC computes forward and backward passes and clips local gradients, mixes parameters, then applies local AdamW updates. Optimizer moments remain local; adaptive consensus is disabled. Validation evaluates the globally averaged model.
| Setting | Value |
|---|---|
| Local models | 8 × 20,403,520 parameters; 163,228,160 total local parameters |
| Architecture per model | 8 layers, width 320, 5 heads, FFN 896, vocabulary 32,000 |
| Topology / scheme | one_peer_exponential / AWC |
| Context / local microbatch | 1,024 tokens / 16 sequences |
| Global batch | 8 × 16 × 1,024 = 131,072 targets; no accumulation |
| Global / per-model training budget | 408,068,096 / 51,008,512 targets |
| Epochs / updates | 40 / 3,119, including shortened epoch-ending steps |
| Other AdamW settings | Weight decay 0.1, epsilon 1e-8, local gradient clipping 1.0 |
| Schedule | 5% token-based linear warmup; cosine decay to 10% of peak LR |
| Epoch evaluation | Fixed 1,024-block validation subset |
| Final evaluation | Full C4 validation split: 197,411,295 targets |
| Preprocessing / validation seeds | 42 / 12345 |
| Execution | GH200 120GB, BF16 autocast, FP32 weights, compiled SDPA, fused AdamW, 8 CPU threads |
| Runtime | Python 3.12.13, PyTorch 2.14.0, CUDA 13.0 |
| Checkpoint policy | none; no model, optimizer, or weight files saved |
Each job simulates eight local workers on one GPU. Physical inter-node communication costs are not measured. Runtime seeds vary initialization and sample order; nondeterministic execution does not guarantee bitwise replay.
Median run time, including validation, was 445.8 seconds (range 432.3–590.7 seconds). Runs used at most 24 concurrent GPUs with a 30-minute allocation limit. No training checkpoints were saved; configuration, environment, logs, metrics, and final validation results are retained.
Audit and artifacts
All 240 Slurm tasks in array 2318595 completed with exit code 0. The audit verified immutable source/config hashes, resolved configurations, runtime source digests and versions, worker counts, training-token and update budgets, complete full validation, finite losses, and absence of checkpoint files. All 80 groups contain exactly runtime seeds 42, 43, and 44; means and sample SDs are recomputed from individual results.
Frozen inputs and run artifacts are under
runs/packed8-awc-20m-batch128k-20260912. The source is based on commit
d0d0d00 plus the archived checkpoint-policy change. The full source digest is
86648f97bc5f1db1f2815351e7f9b512549cf0d04519528eacb6112d157c7dd1. The results JSON records the frozen input hashes,
per-run result/config/environment hashes, and the four-worker reference hash.
- Per-run CSV: all 240 measurements and artifact locations.
- Summary CSV: all 80 ranked configurations.
- Results and provenance.
- Matched four-worker comparisons.
- Slurm accounting.
- Collection script.
- Plot script.
- Report generator.
Reproduction
The winning recipe is configs/packed8-20m-awc.yaml. With the prepared C4 cache, run:
uv run tiny-llm train --config configs/packed8-20m-awc.yamlThe recipe saves a final checkpoint for subsequent evaluation or analysis.
Add --set training.checkpoint_policy=none to reproduce the sweep’s checkpoint-free
retention. Repeat with runtime seeds 43 and 44 in separate output directories.
The preset explicitly selects eight AWC workers and supplies the measured optimizer
settings, architecture, global batch, and training budget. For exact frozen
configurations, use the archived config files and source. Checkpoint-free runs
retain evaluation metrics but cannot be resumed or used for checkpoint analysis.
Regenerate figures and this report from the audited data:
uv run python doc/data/recipe_sweep_packed8_awc_20m_128k/plot.py
uv run python doc/data/recipe_sweep_packed8_awc_20m_128k/write_report.py